Visualize your data from cloud with DoubleCloud and ClickHouse DB
Visualize your data from cloud with DoubleCloud and ClickHouse DB
Today, I will introduce to you a new platform I found for integrating your Cloud provider (AWS, GCP, Azure) and visualizing the data: DoubleCloud.
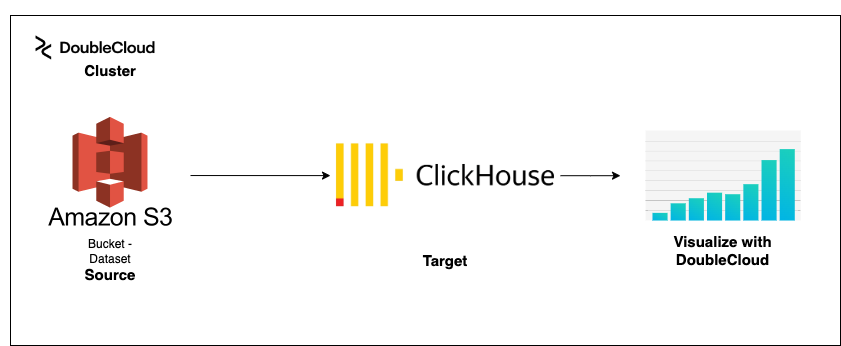
For those who don’t know, DoubleCloud is a new platform that helps you build sub-second data analytical solutions and pipelines on proven open-source technologies like ClickHouse® and Apache Kafka®.
The reason why I wrote about this tool was the same reason I found visualizing data from cloud providers automatically can be a bit hassle. Of course, there are other players in this function too like AWS QuickSight, Tableau, etc. However, I believe that this particular new tool offers unique features, and DB options, that make it worth considering for anyone who regularly works with data from cloud providers.

For your inquiries:

ClickHouse is a powerful and high-performance database management system designed for real-time data processing and analysis. It was originally created by Yandex, a Russian search engine, to support their web analytics platform called Metrica. Compared to other database providers, ClickHouse is an open-source software that uses a columnar data model to store and retrieve data. This means that data is stored in columns rather than rows, which allows for faster query processing and data compression. ClickHouse is particularly well-suited for OLAP workloads, where complex queries are executed on large datasets. It supports SQL-like query language and allows for real-time data processing and analysis, making it ideal for applications that require fast and accurate insights from large volumes of data.

Apache Kafka is a software platform that facilitates the distributed processing of large volumes of data streams in real-time. It is an open-source system that allows companies to build high-performance data pipelines, real-time data processing systems, and streaming analytics applications at scale. Apache Kafka allows users to publish, subscribe to, store, and process streams of records in real-time. It is designed to handle large volumes of data efficiently, allowing users to process data as it arrives, without the need to wait for it to be fully collected or batched. One of the key benefits of Apache Kafka is its ability to handle large-scale data processing tasks across multiple nodes in a distributed environment. It provides high availability and fault tolerance, ensuring that data streams are processed consistently and reliably.
In this blog, we will use ClickHouse as our main DB connection.
Table of content
-
Preparing our dataset
-
Create Cluster — Setting up DoubleCloud
-
Transfer — Create a connection between your AWS S3 Database and ClickHouse
-
Visualize your dataset
Preparing our dataset
Getting the data.
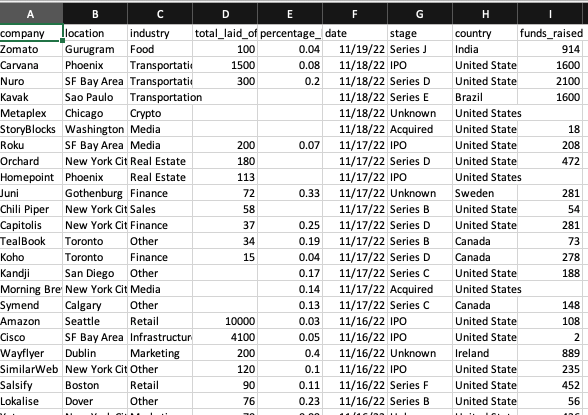
In this blog, we will use the layoff dataset from my previous blog. You can get it here from Kaggle (FYI, you might need to log in to download the dataset). The dataset will be named “layoffs.csv”
Uploading the dataset to AWS S3 Bucket
As of now, DoubleCloud offers connections with AWS so we will use AWS as our endpoint.
To upload your dataset to AWS S3 Bucket, you need to:
-
Sign in to the AWS Management Console and open the Amazon S3 console at https://console.aws.amazon.com/s3/.
-
In the left navigation pane, choose Buckets.
-
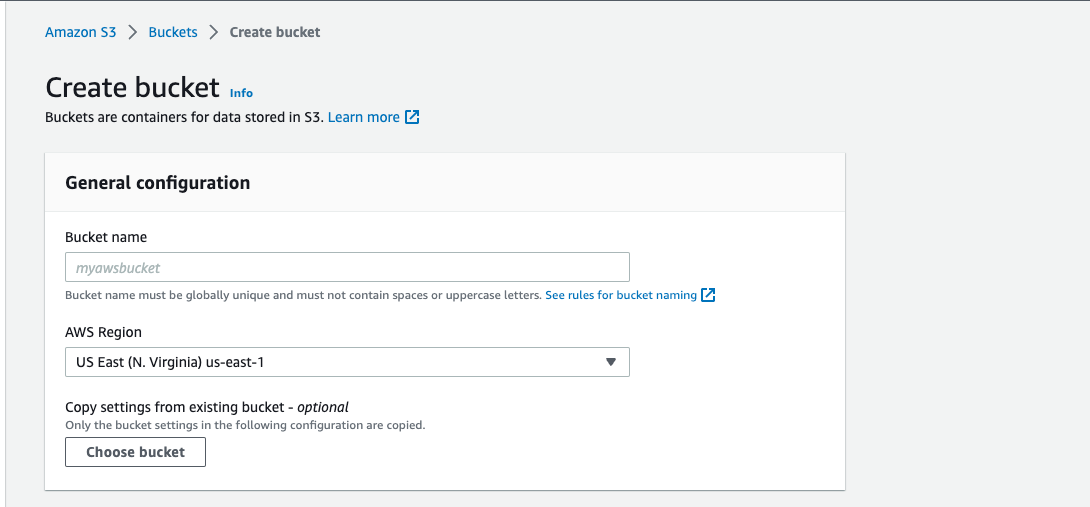
Choose Create bucket.
-
The Create bucket page opens.
-
For Bucket name, enter a name for your bucket. For now, let’s name it doublecloudtest
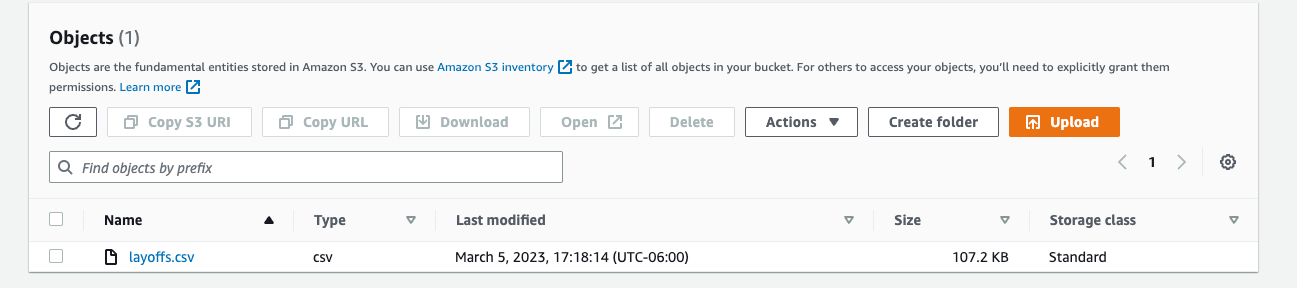
- Once your bucket is created, upload your dataset “layoffs.csv” from your local computer.
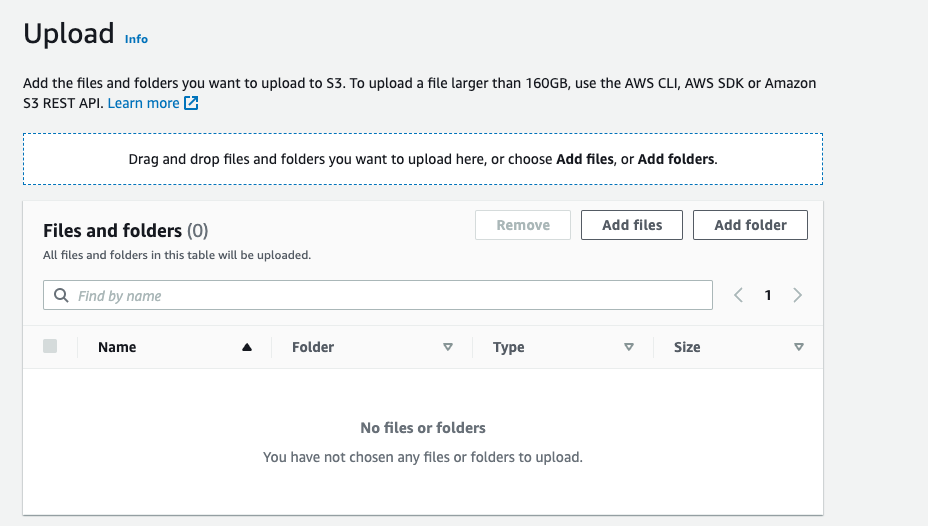
- The result should be like this.
More on creating AWS S3 Bucket from here.
Note that, this tutorial only focuses on csv file. In real life, you might configure for the real-time database.
Setting up DoubleCloud
- First, you need a Managed ClickHouse® cluster.
-
To do this, create or log in to your account. Go to console.
-
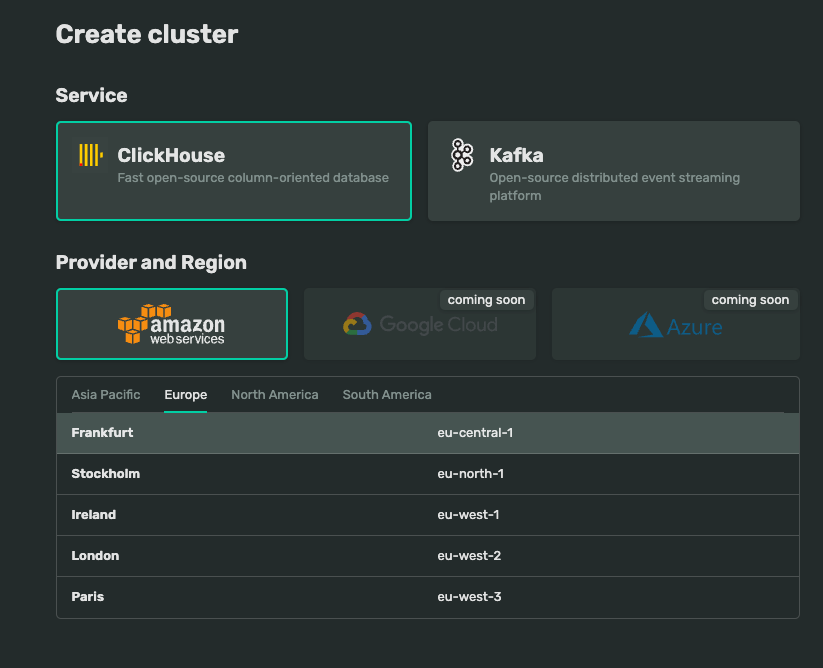
Create a Cluster with ClickHouse service. Let’s name it “doublecloud1” for now
-
At this moment, DoubleCloud is supporting AWS. We will choose AWS as our data source now.
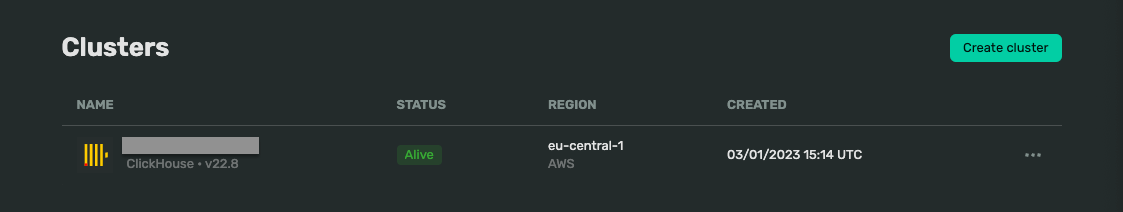
- For now, we will use default settings for our tutorial. Click submit to create a cluster. Once your cluster is done, the status will be Alive.
Create a database on the newly created cluster
-
Install ClickHouse.
For MacOS
curl https://clickhouse.com/ | sh
For Linux
curl https://clickhouse.com/ | sh sudo ./clickhouse install
-
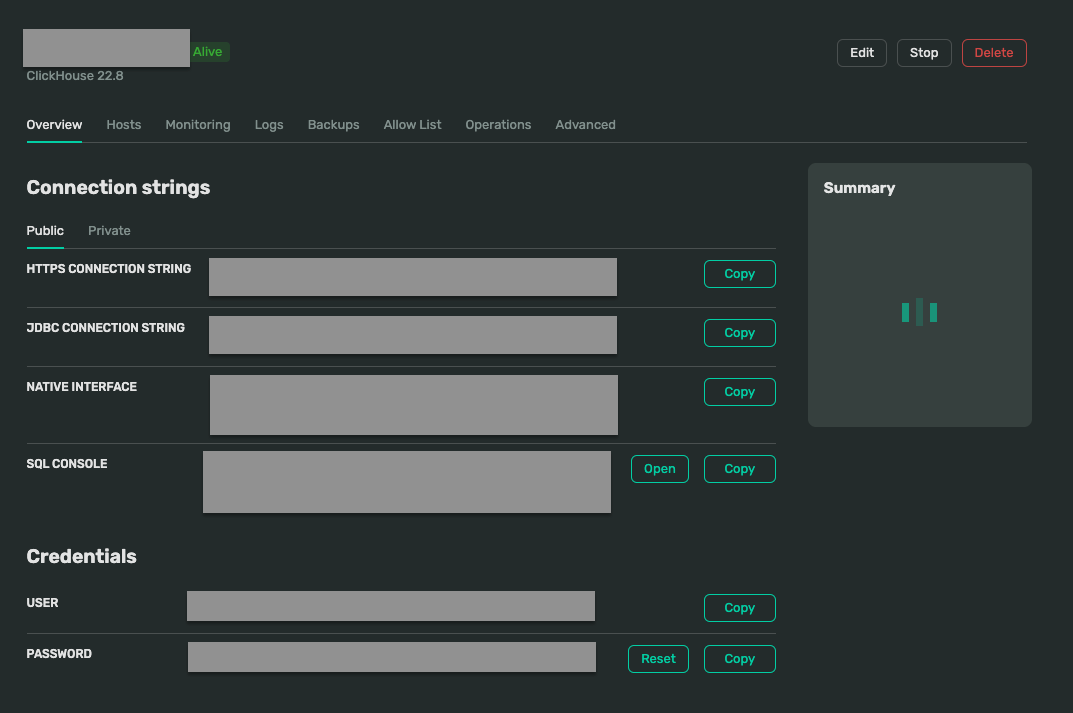
Go to your Cluster detail on DoubleCloud, copy the native interface code, and run in the terminal. It should look like this:
clickhouse-client — host ********.at.double.cloud — port **** — secure — user admin — password **********************
Notice that you might change the code due to recent ClickHouse’s update.
./clickhouse client — host ********.at.double.cloud — port **** — secure — user admin — password **********************
Note that you will need to save the user, **and **password information elsewhere for later usage in the transfer.
- Create a database from your terminal
create database [YOUR_DATABASE_NAME] on CLUSTER [DOUBLECLOUD_CLUSTER_NAME]
where:
-
YOUR_DATABASE_NAME: the name you want for your database. Let’s do it Sample-ClickHouse-DB for now
-
DOUBLECLOUD_CLUSTER_NAME: The name of your DoubleCloud cluster, which is “TestCluster” for now.
Create a connection between your AWS S3 Database and ClickHouse
-
Go to Transfer.
-
Go to Endpoints.
For source:
-
Click Create endpoint, choose Source
-
Choose AWS S3 as your source
-
Choose a name of your choice. For now, let’s name it s3-source-quickstart
-
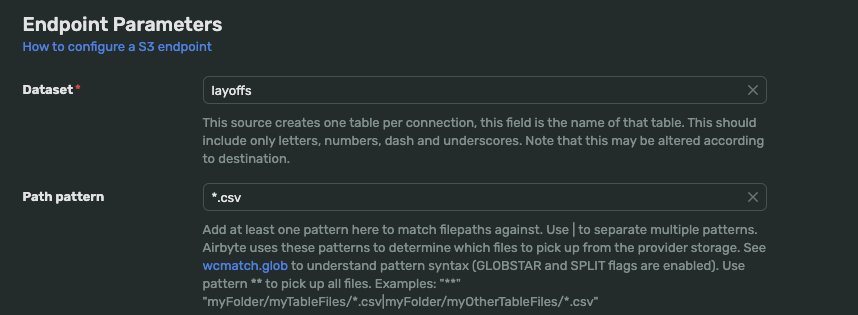
Configure your endpoint parameters:
-
Dataset is layoffs
-
path pattern is *csv
-
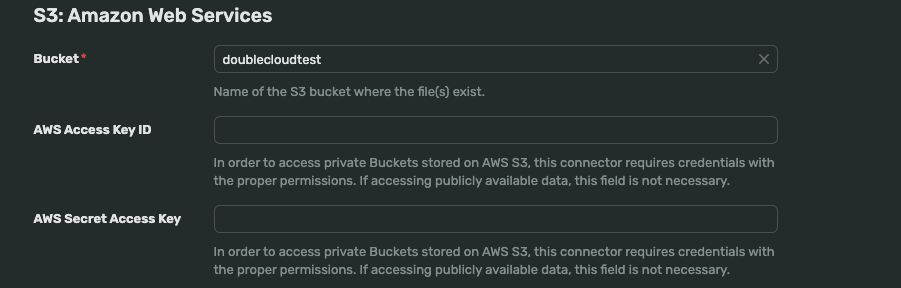
In the S3: Amazon Web Services, enter your bucket name, AWS Access Key ID, and AWS Secret Access Key.
-
Submit.
To get your AWS access key ID and secret access key
-
Open the IAM console at https://console.aws.amazon.com/iam/.
-
On the navigation menu, choose Users.
-
Choose your IAM user name (not the check box).
-
Open the Security credentials tab, and then choose Create access key.
-
To see the new access key, choose Show. Your credentials resemble the following:
-
Access key ID: AKIAIOSFODNN7EXAMPLE
-
Secret access key: wJalrXUtnFEMI/K7MDENG/bPxRfiCYEXAMPLEKEY
- To download the key pair, choose Download .csv file. Store the .csv file with keys in a secure location.
For target
-
Click Create endpoint, choose Target
-
Choose ClickHouse as your target
-
Choose a name of your choice. For now, let’s name it clickhouse-target-quickstart
-
Configure your endpoint parameters:
-
Database is Sample-ClickHouse-DB
-
Pass your user and password from your Cluster information.
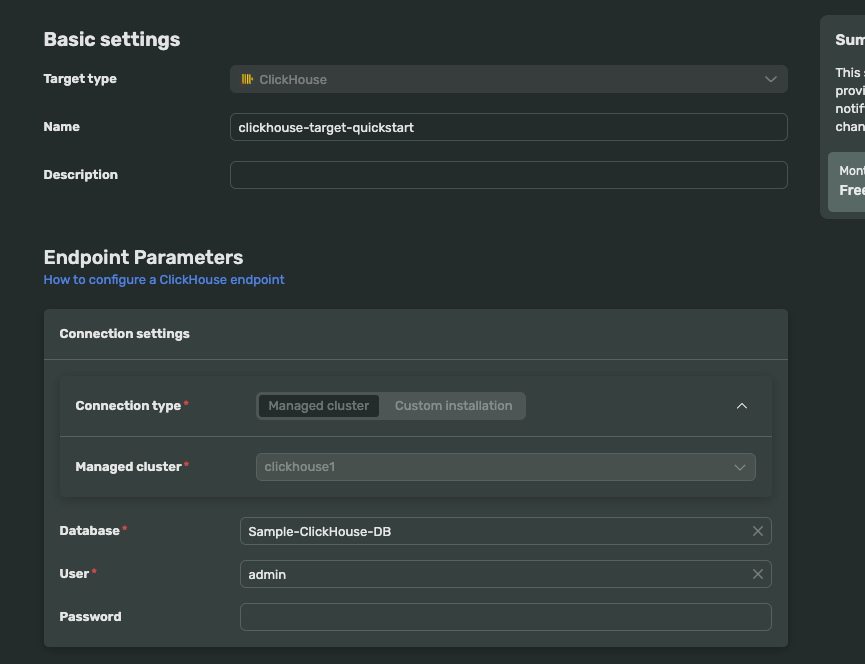
-
Leave the rest for the default settings.
-
Submit.
Test the connection
Once source and target endpoints are created, go back to the transfers tab and choose Activate.
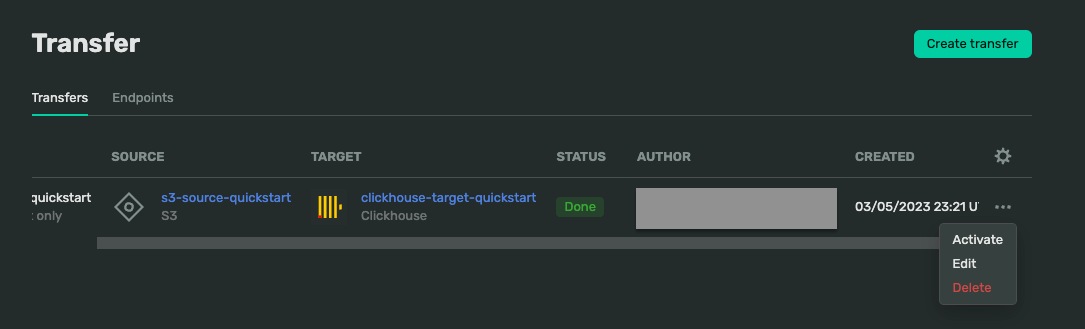
If the status is Done, the connection is successful.
If the status is Error with the red color, click on the Error, then Logs, to see the error message. Usually, double-check if you already entered all the correct credentials from ClickHouse and AWS.
Visualize your dataset
-
Go to Visualization.
-
Create a new workbook. Let’s name it Demo Workbook.
-
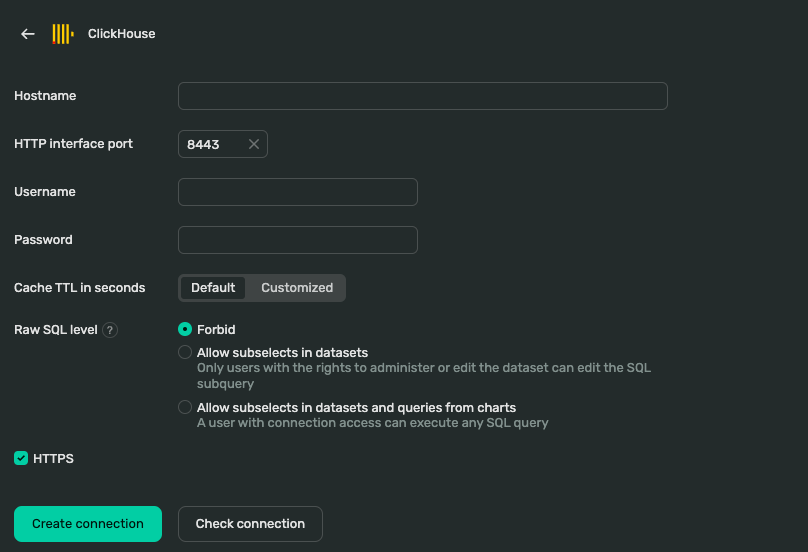
Create a new connection. Choose ClickHouse. The interface will ask for Hostname, Username and Password.
-
Go to your cluster from Clusters, and go to Hosts to obtain host information
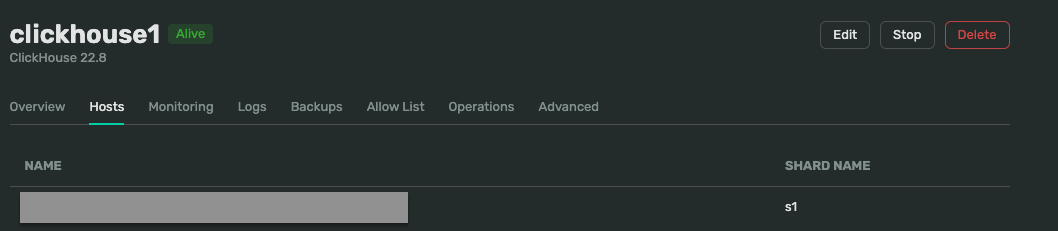
- Copy host, username, and password in the Connection.
-
Check connection. If there is a green tick then Create connection.
-
Create dataset. Select the layoffs dataset.
You might see the column is combined as a string instead of separate columns.
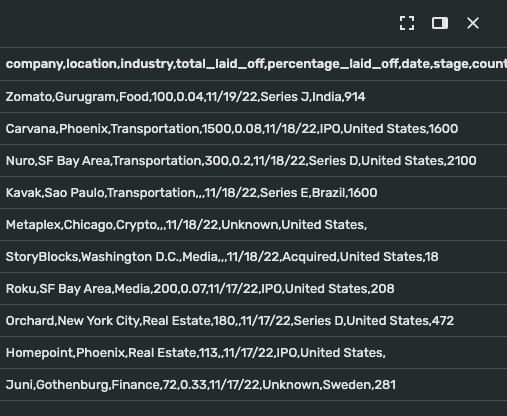
While this is a small issue, to handle this, we create a new field. Let’s name it the company for example. There, we split the combined string with “,” and select the first index returned from the split array, which is the company name. Choose formula, then enter this below
SPLIT([company,location,industry,total_laid_off,percentage_laid_off,date,stage,country,funds_raised], ",", 1)
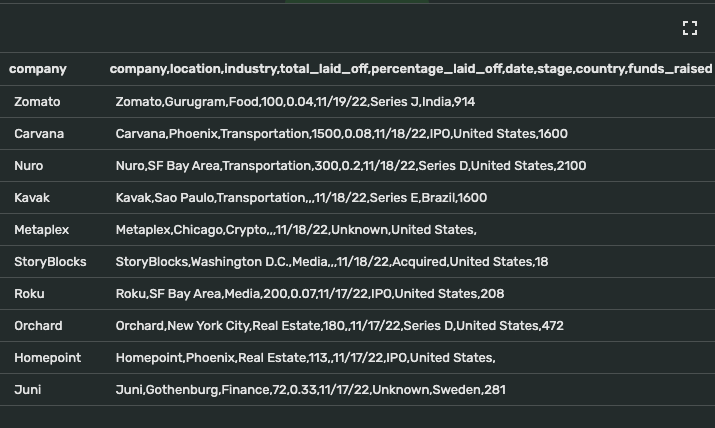
Click save. Do the same for other columns you want to add. Remember to change to the corresponding type (string, integer, fractional number, etc).
For now, let’s create 2 new fields with industry (index 3), and total_laid_off (index 4) for simple visualization.
// industry
SPLIT([company,location,industry,total_laid_off,percentage_laid_off,date,stage,country,funds_raised], ",", 3)

// total_laid_off
SPLIT([company,location,industry,total_laid_off,percentage_laid_off,date,stage,country,funds_raised], ",", 4)
-
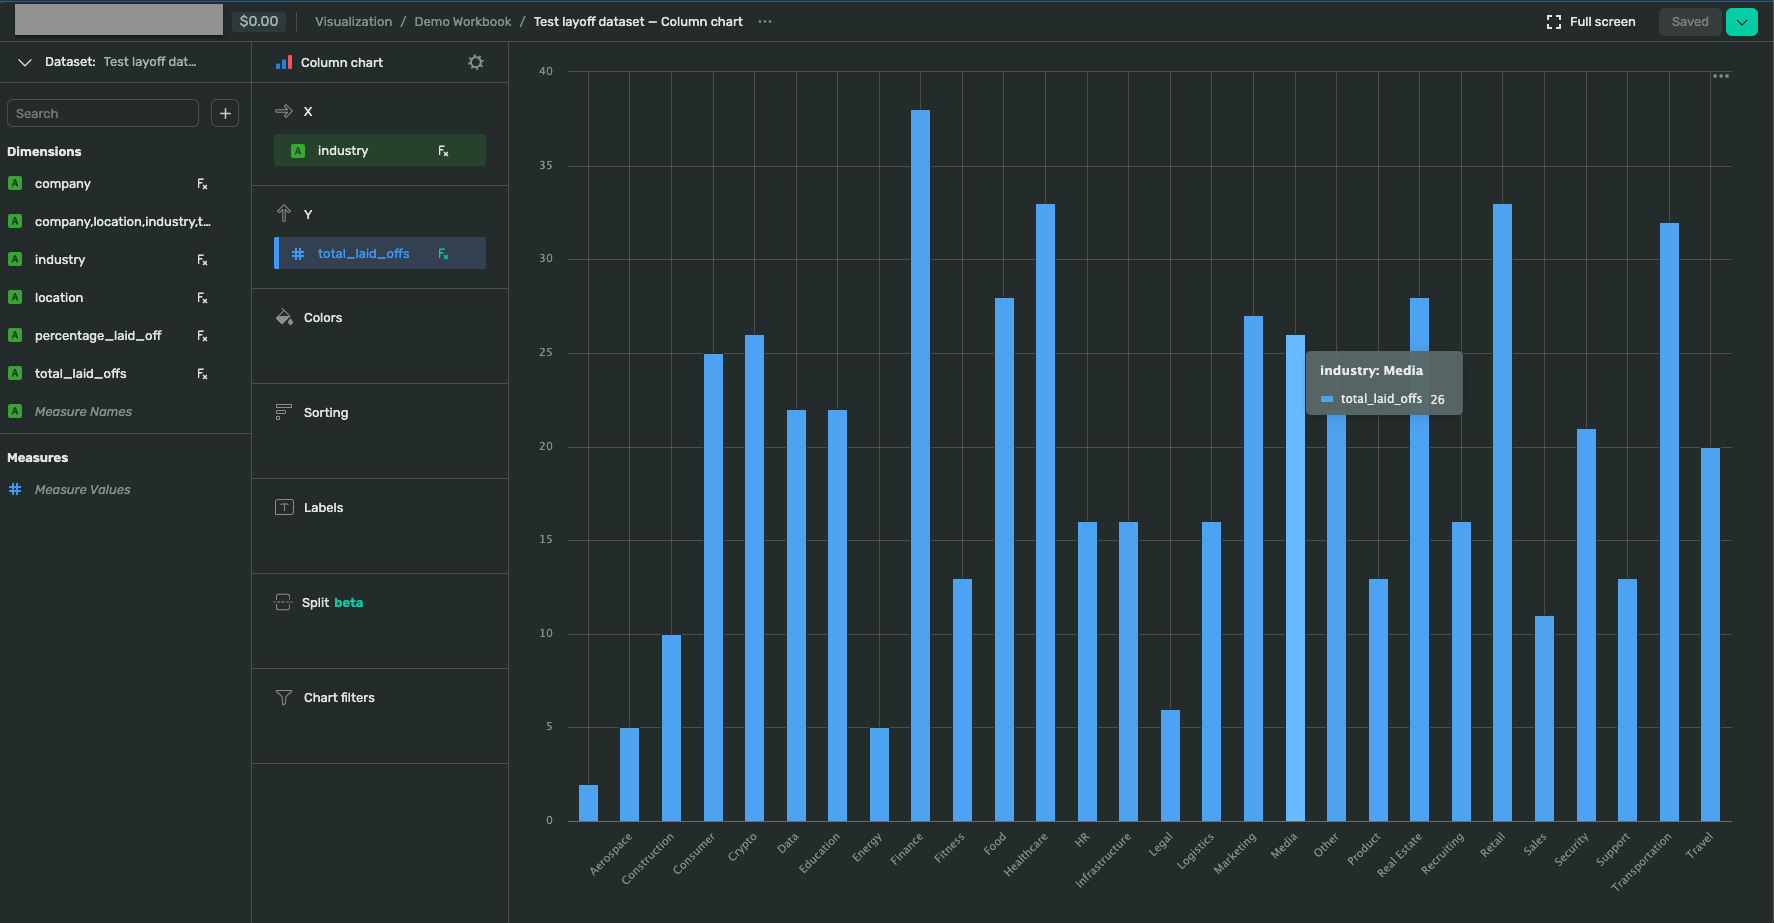
Once the database preparation is done, click create chart
-
Drop total_laid_off in Y, and industry in X. The result will be as below.
Conclusion
If you reach this far, congratulations! You just learned to visualize your data from the cloud provider (AWS S3) with DoubleCloud and ClickHouse.
My thought on this new platform is that it is very simple to use: the visualization tool with drag and drop reminds me of Tableau. Meanwhile, the simple experience to connect with data from a cloud provider with no code is impressive. Really looking forward to seeing how DoubleCloud goes in the future with more Cloud options from GCP and Azure.
References
-
AWS S3 Documentation
-
AWS IAM Documentation
-
DoubleCloud Documentation
-
ClickHouse Documentation